¶ Software Manual
Version 1.0 Last Revised 22.01.2021
All contents in this manual are copyrighted by JAVAD GNSS. All rights reserved. The information contained herein may not be used, accessed, copied, stored, displayed, sold, modified, published, or distributed, or otherwise reproduced without express written consent from JAVAD GNSS.

¶ Introduction
The JAVAD GNSS Monitor software estimates point displacements, the coordinates of which are calculated from the automatic processing of GNSS measurement files accumulated over a standard time interval.
In the Monitor software, reference points (bases), the position of which is assumed to be fixed, and monitored points (rovers) are set. The detection and analysis of rover displacements are performed based on user-defined geometric and statistical thresholds. The analyzed values are the differences between coordinates of rovers at current measurement epoch, and their positions at the initial monitoring epoch, and their accuracy estimates.
The accuracy of monitoring depends on many factors, such as GNSS observation conditions (satellite visibility, multipath and radio interference), the satellite systems used, the duration and data rate of recording the processed files, the distance between bases and rovers, and other parameters.
¶ Main functions of Monitor
-
Settings for GNSS processing and analysis of point displacements
-
Defining the monitoring network points, their initial coordinates, addresses for recording measurement files and calculated displacements
-
Processing of GNSS measurement files for monitoring epochs
-
Calculation of displacements
-
Plotting displacements
-
Monitoring logging
-
Map of the monitoring network
¶ Preparation of the monitoring system
The following initial activities should precede the start of the monitoring process in operational mode:
-
Planning and preparation of places for installation the GNSS receivers. The base receivers should be located in open for GNSS observations and tectonically stable places. As for rovers located at the monitored points, their antennas should, if possible, be installed in areas free from multipath and be reliably fixed.
-
Integration into a common network of all receivers.
-
The setting up the receiver observation data rate, the length of the measured files and other parameters, using the programs such as NetView and NetHub.
-
After installing and configuring the receivers and organizing communication between them and the GNSS data processing center, the monitoring system is initialized. The initialization process includes:
- Tying all points of the monitoring network (bases and rovers) to the global coordinate system WGS84 / ITRF. The coordinates of the base receivers and the starting positions of the rovers should be determined at the millimeter level of accuracy. The GNSS observations of a day or more, which must be processed by geodetic programs such as Giodis are used to achieve this goal. In this case, the observations from the nearest reference points of the international GNSS network IGS (International GNSS Service) are also used..
- Installation of the Monitor program and entering the necessary initial monitoring parameters (see further in the Manual).
- Trial run of the monitoring system to check the reliability of the functioning of all its components.
-
After checking all the monitoring system components at the initialization stage and eliminating possible problems, the process of monitoring the network in operational mode is started.
¶ Graphical user interface
The initial Monitoring screen of the monitoring program looks as follows:
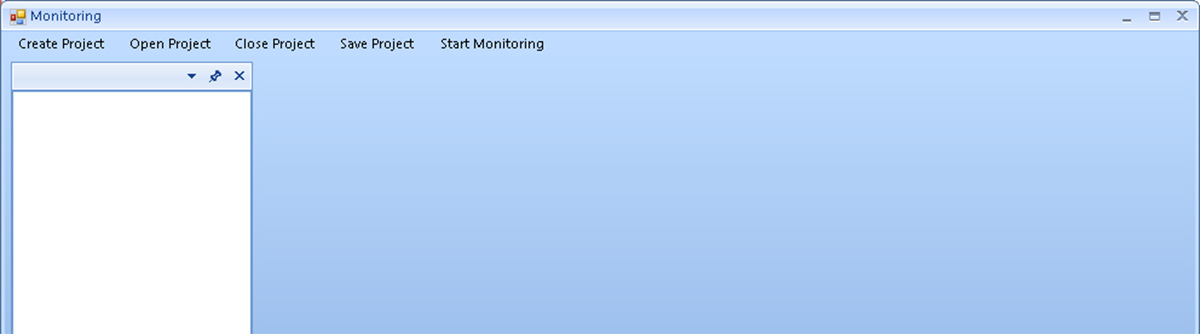
Figure 1. The initial screen
When you select the Create Project menu item, a dialog opens in which you enter the name of the new monitoring project:
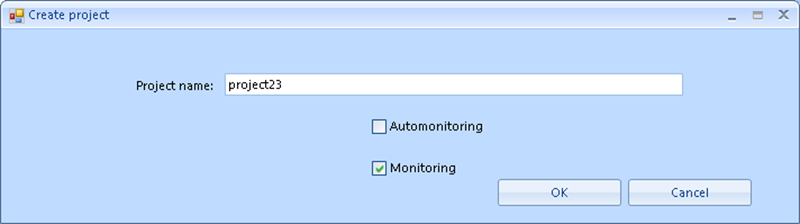
Figure 2. Create project
Once the name of the new project is entered, click OK. The project screen looks like this:
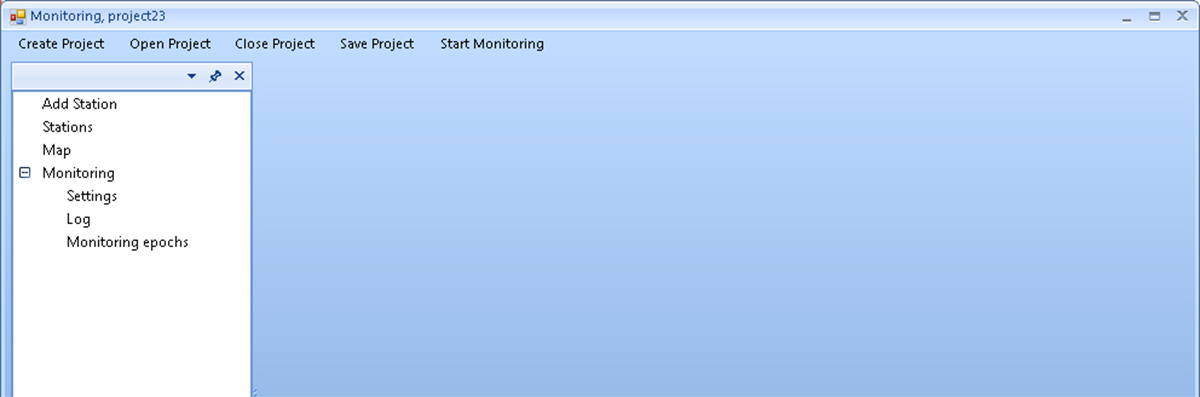
Figure 3. Project window
Next, the settings for this project are entered.
¶ Settings
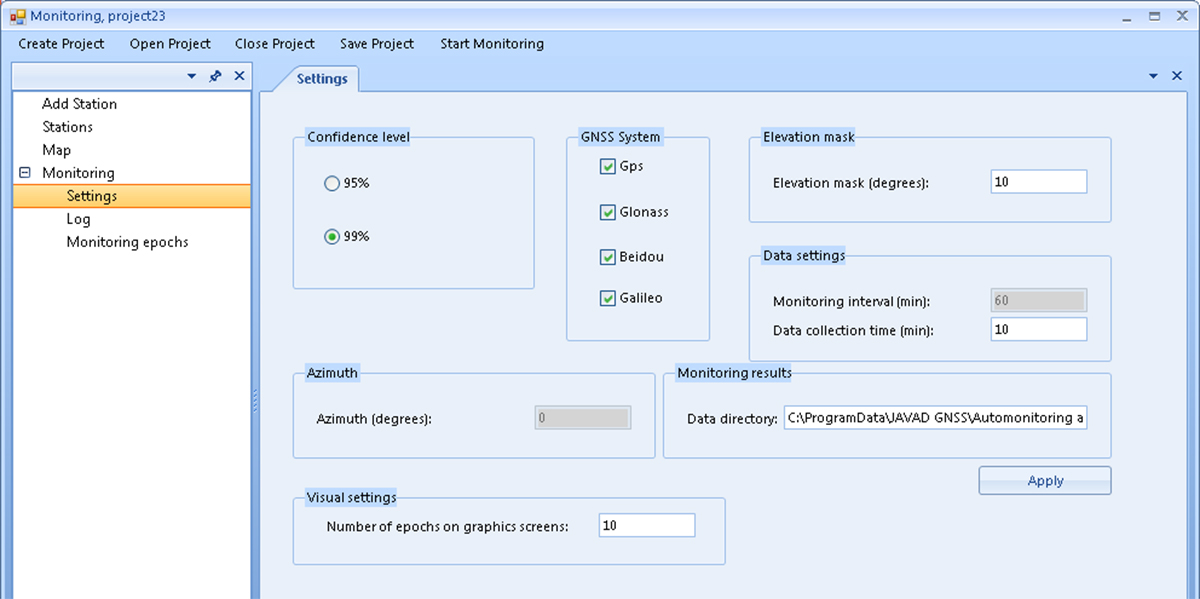
Figure 4. Settings Screen
Use the Settings screen to enter the settings common to all the points of the monitoring project:
- Confidence level – the selection of the confidence interval for GNSS processing.
- GNSS System – the selection of GNSS systems.
- Elevation mask – the elevation angle of the satellites used in the processing.
- Data settings – control parameters for the GNSS measurement processor:
- Monitoring interval – the time between monitoring epochs (duration of standard GNSS measurement files);
- Data collection time – allowable waiting time for the arrival of GNSS measurement files from network stations to a computing center (CC) to start processing data for the current monitoring epoch. If a file from any station was not received in time, then processing of this epoch will be carried out without it.
Note: If, after the selected waiting time, such a file still arrives from the station to the CC, then it is written into memory for subsequent post-processing and a posteriori calculation of its coordinates for the skipped epoch.
- Azimuth – is a parameter that can be entered for monitoring objects such as dams or bridges where the rovers are located approximately along a straight line. Accounting for azimuth angle for such cases allows estimating displacements along and across this object.
- Visual settings – the graphical settings (how many epochs to display simultaneously on the displacement plots).
- Monitoring results – this section describes the monitoring results; namely, the Data directory field contains the path where the files with the processing results will be saved. By default, this is the Program Data: "Program Data\Javad GNSS\Automonitoring and monitoring\Output".
¶ Add Station
After entering the monitoring’s common settings, the Add Station screen is used to enter the information about each point:
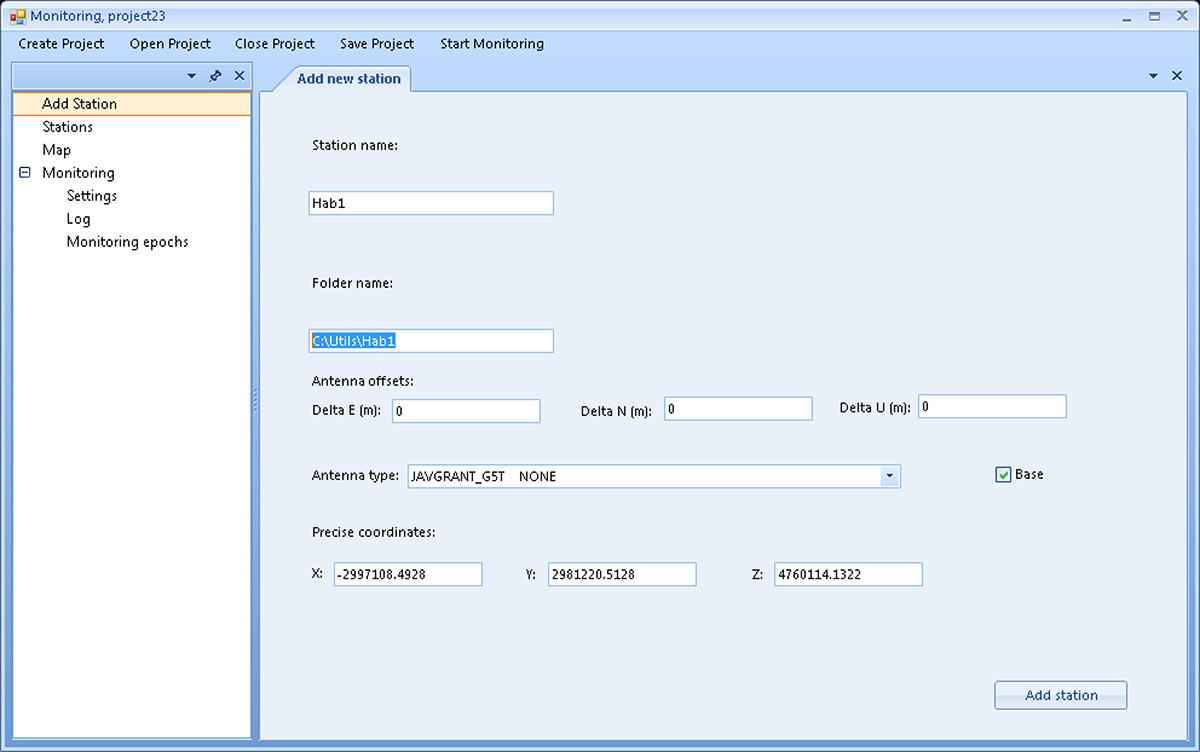
Рисунок 5. Add Station (Base)
If you want to define a station as a base, you must check the Base checkbox, and if you’re going to create a rover, you must clear the checkbox. For rovers, fields for entering position sigmas will also appear.
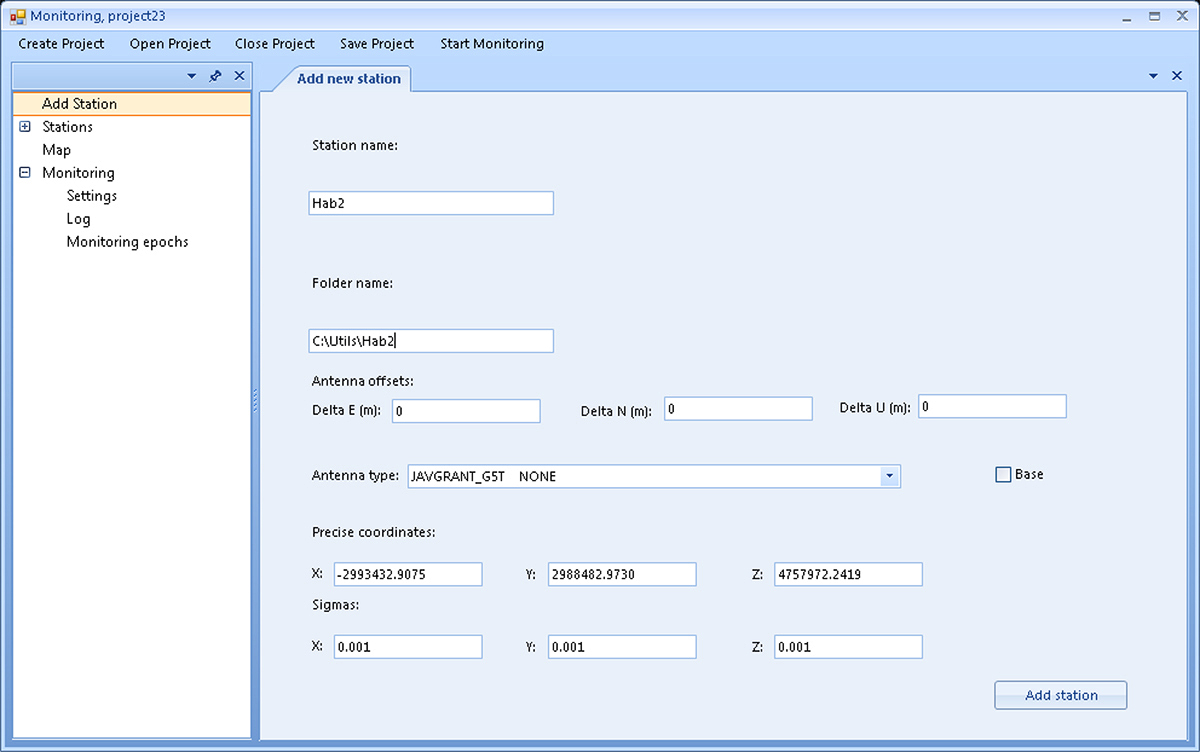
Рисунок 6. Add Station (Rover)
- Station name – point name.
- Folder name – the folder’s address where the GNSS measurement files for this point are saved.
- Antenna offsets – the antenna’s offsets relative to the monitored point (to the east, north and up).
Note: The antenna offsets’ parameters, if they exist, must be accurately measured at the initialization stage of the monitoring system, before it is started in operating mode.
- Antenna type – select the needed antenna’s type from the drop-down list.
- Base – check the box to use the point as a base.
- Precise coordinates – the coordinates of the point, determined at the initialization stage (see the section Preparing the monitoring system for operation above).
Warning! The values of these coordinates, both for bases and for rovers, entered in the Precise coordinates fields should be carefully checked. Entering incorrect or inaccurate values can lead to errors in GNSS processing and incorrect monitoring results.
- Sigmas – for rovers, in addition to their coordinates, it is also necessary to enter their accuracy estimates obtained during the initialization of the monitoring network.
After clicking the Add Station button, the station is added to the list of project points.
The Start Monitoring menu item starts the monitoring process. In case of entering incomplete or contradictory information (a single point is entered; monitoring bases are not assigned; all points are marked as bases, etc.), a corresponding warning may be issued. After clicking on Start Monitoring, the caption changes to Stop Monitoring, and when you click on Stop Monitoring, the monitoring process stops, and the caption on the button changes again to Start Monitoring, etc.
The Stations menu item provides information about the points of the project. After clicking on this menu item, the Stations screen opens, where a list of project points, types of their antennas, and their use status - as bases or rovers is given.
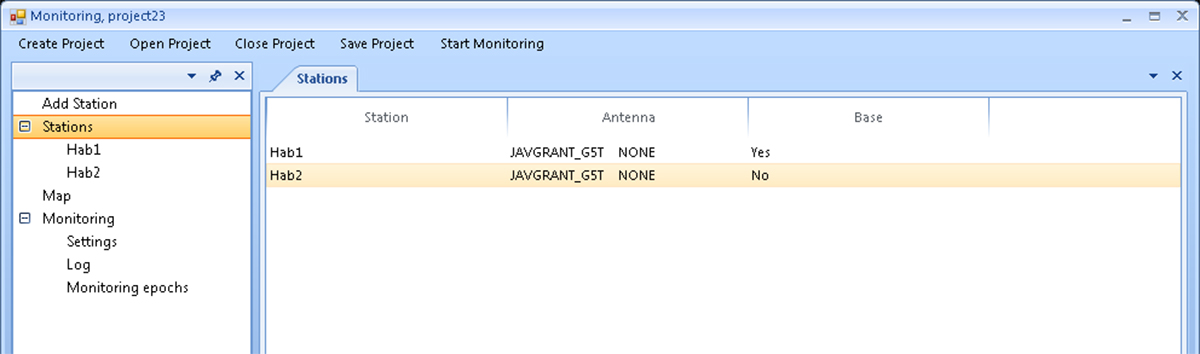
Figure 7. Stations
¶ Station Information
The Station information screen displays the Station name, its previously entered X, Y, Z coordinates (see the Add new station screen), and gives access to its monitoring plots. The plots show the displacements Dx, Dy, Dz along the X, Y, Z axes of the WGS84 / ITRF coordinate system, as well as the displacements Dn, De, Du in the north, east, and vertical directions. Also, Across and Along offsets can be shown (see the Settings screen’s above description for project settings).
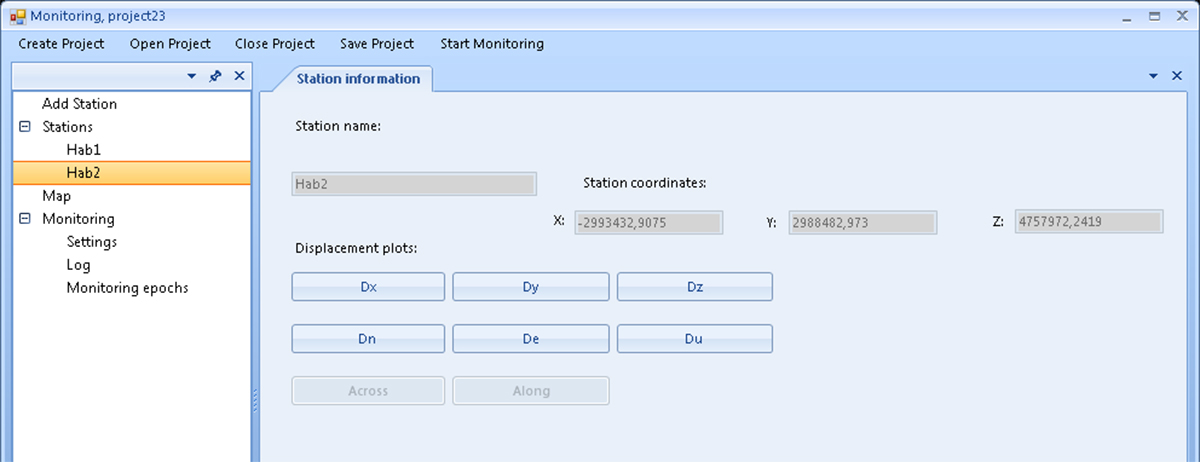
Figure 8. Station information
Below the examples of plots of point displacements along the X, Y, Z axes are shown. The triangles show the displacement values, and the rhombuses show their accuracy estimates (plus and minus one sigma):
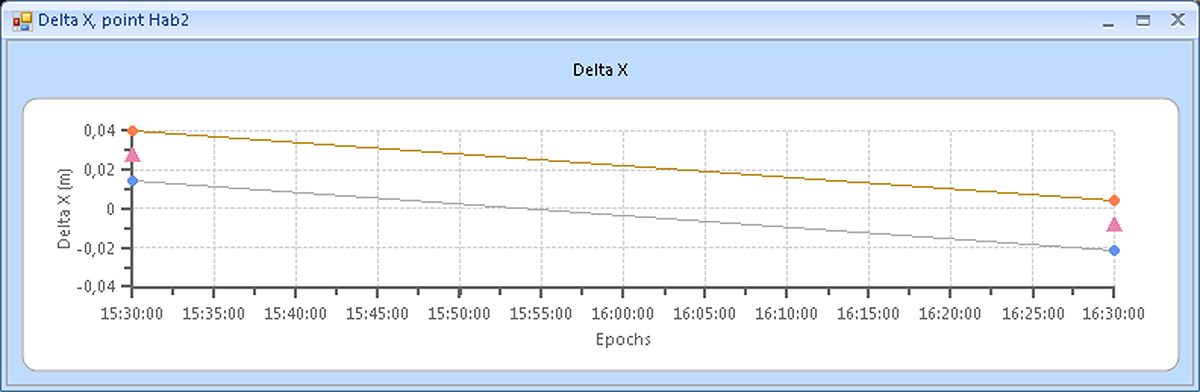
Figure 9. Example 1
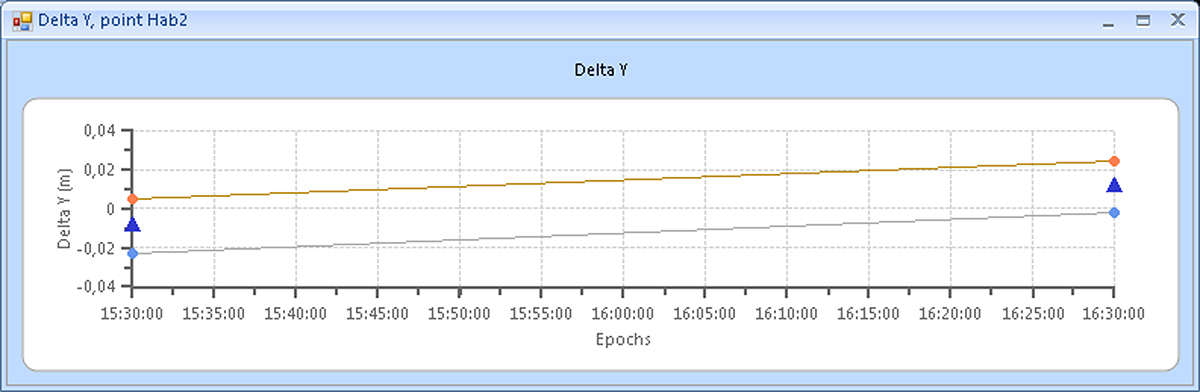
Figure 10. Example 2
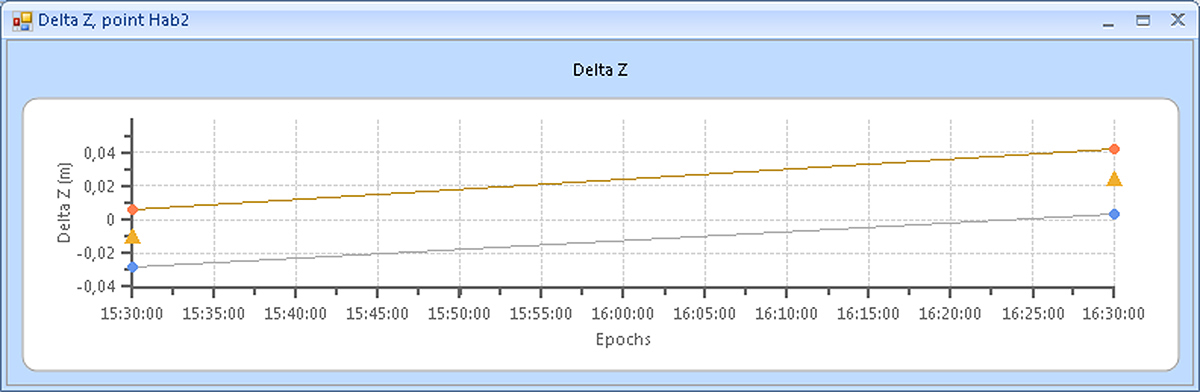
Figure 11. Example 3
¶ Monitoring network map
Clicking on this menu item shows a map of points of the project.
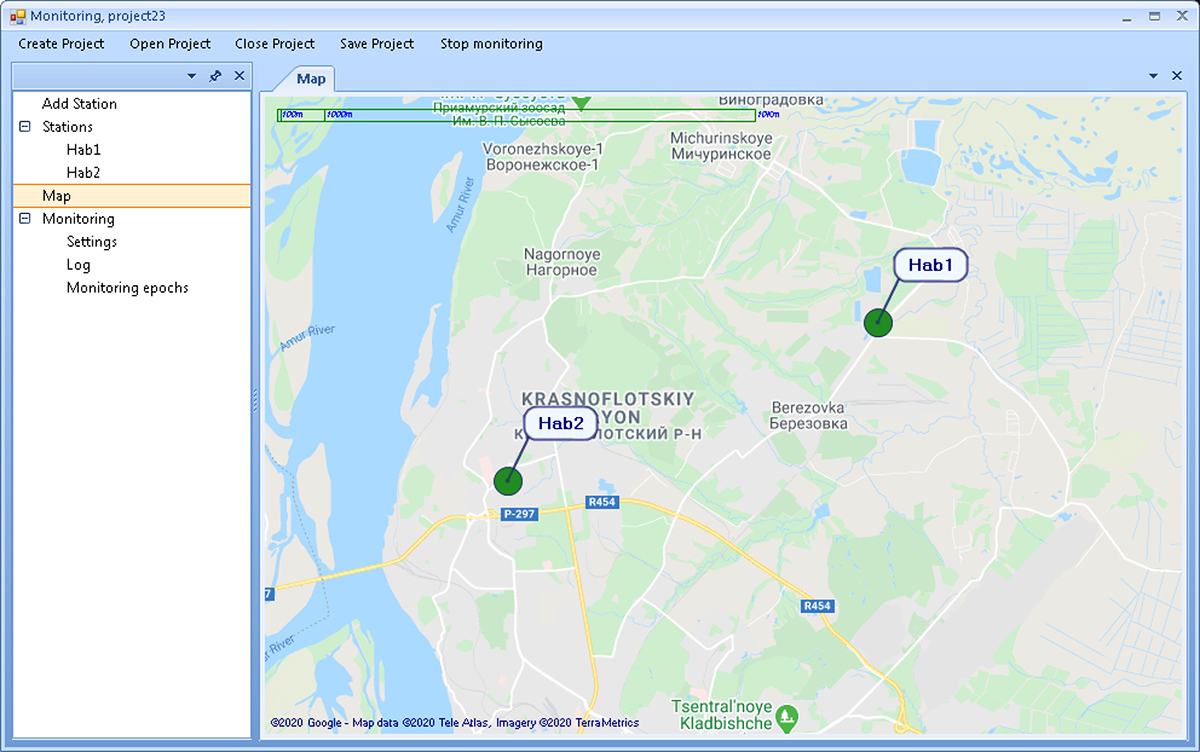
Figure 12. Monitoring network map
¶ Monitoring Log
The monitoring log records significant events that occur during the monitoring process.
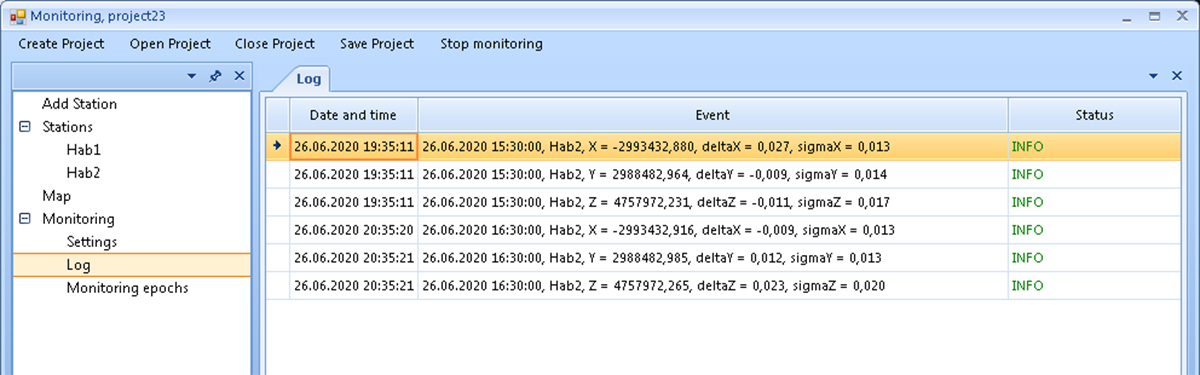
Figure 13. Log
¶ Monitoring epochs
The Monitoring epochs screen displays information about the monitoring epochs: the start and end times of recording GNSS measurement files, and the status of their processing results.
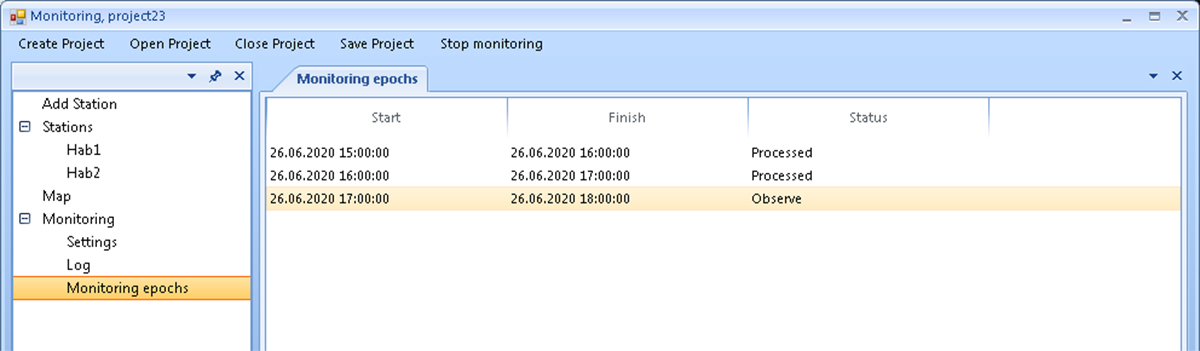
Figure 14. Monitoring epochs
¶ Opening the project
After clicking on the Open Project menu item, a dialog for selecting an existing project will appear. Such a project can be selected from the drop-down list or enter its name in the input field and click OK. After that, the selected project will be loaded.
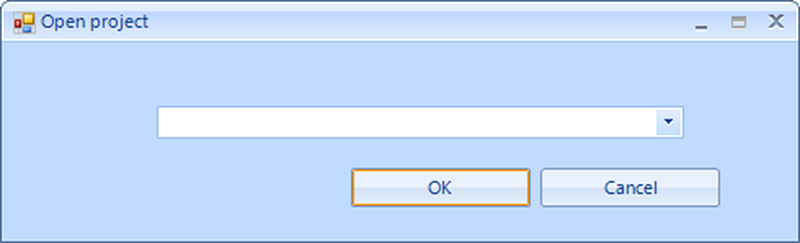
Figure 15. Open project
For example, for the case when the project23 project has already been created, a window like this will open:
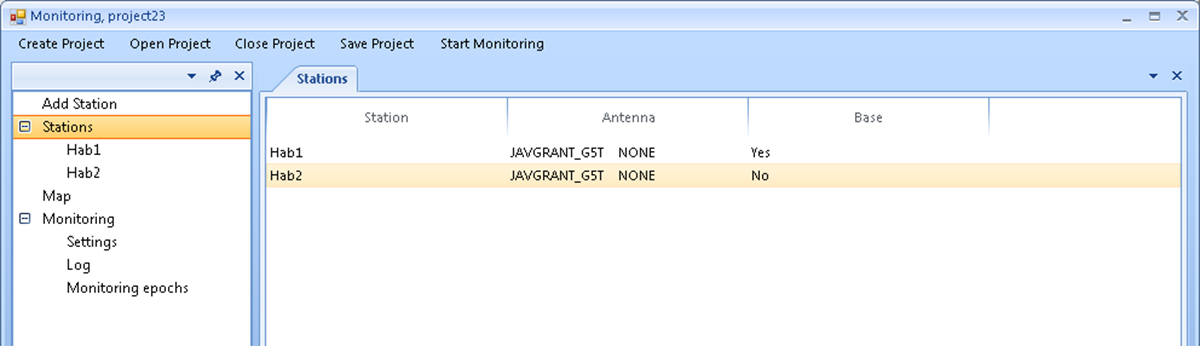
Figure 16. Saved project window
¶ Closing the project
By clicking the Close Project, the current project will be closed.
If you decide to close the project while monitoring is running, the following warning will appear.
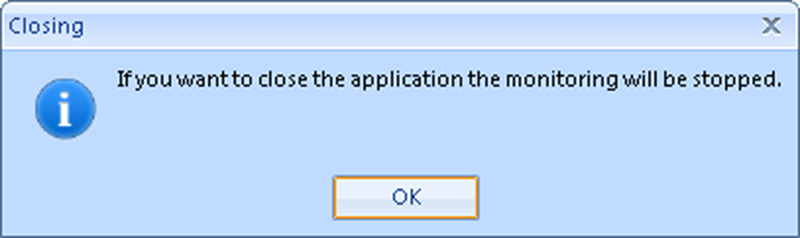
Figure 17. Warning
Also, before closing, the program will offer to save the changes in the project.
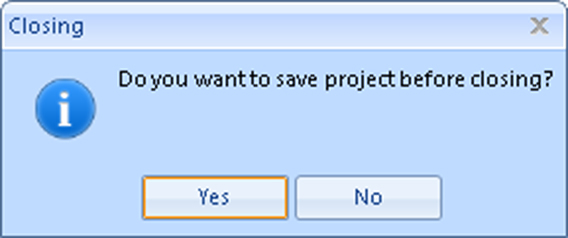
Figure 18. Save before closing
¶ Saving the project
The clicking by Save Project will save the current project.
900 Rock Avenue, San Jose, CA 95131, USA
Phone: +1(408)770-1770 Fax : +1(408)770-1799
www.javad.com
All rights reserved © JAVAD GNSS, Inc., 2020